EIS KPIs
The KPI tab provides a graphical snapshot of performance indicators and recent trend patterns of the KPI under the selected hierarchy level. You can easily identify which KPIs are off track based on traffic lights indicators.
Performance indicators are shown based on level of planning or organisational hierarchy.
STEP 1: To view KPIs, click on 'KPIs' tab.
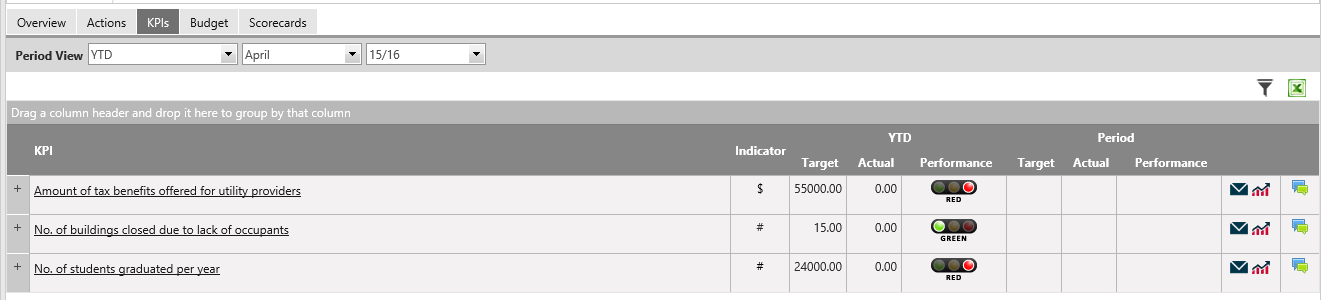
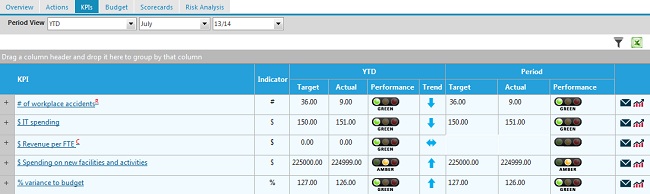
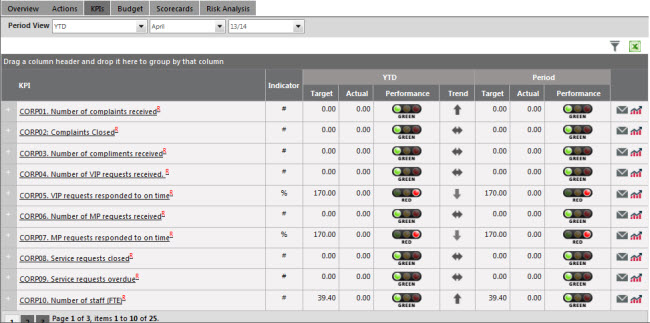
KPIs on this page are ordered by KPI Title. Information shown on the left are the targets and actuals for the relevant time-frame listed in the Period drop down. You can use this to view information for a different time period.
Select the period view using the given drop-down list.
YTD values - displays the cumulated KPI values from the beginning of the financial year to the date that the KPI is been viewed.
Period values- displays the KPI value for the last closed period nearest to the date that the KPIs is been viewed.
 |
KPIs will only show data within selected period. If the KPIs reporting "period" is not in line with the month selected (for example an Annual KPI has been linked but you are viewing the 'December' period) then the KPI will not show until you view for June period (end of the financial year).
Monthly KPIs will always display the target/Actuals for the selected period. Annual KPIs will only show in June at the end of the period. Quarterly KPIs will only show in the period view at the end of the period.
When using period, ensure that the date range selected exceed or equal to one month.
|
|
Field
|
Description
|
|
KPI
|
Displays the KPI title defined within Manage KPI area
|
|
Indicator
|
Displays the KPI indicator selected within Manage KPI area.
|
|
Target
|
Displays the Target values defined within KPI Target/Actual area for the selected period.
|
|
Actual
|
Displays the Actual values defined within KPI Target/Actual area for the selected period.
|
|
Performance
|
Displays the KPI performance through traffic lights
|
|
Trends
|
Displays the KPI Trend (scroll down for more information on KPI Trend calculation)
|
|
Email
|
Displays the email control
|
|
Chart
|
Click to view the chart
|
STEP 2: Click on the filter icon to expand the filter area. You can use the below filter options to look up for the relevant KPIs.
|
Filters
|
Description
|
|
Search
|
Type a key word to do a search
|
|
Agency
|
Select the agency
|
|
Responsible Officer
|
Select the responsible officer
|
|
Reporting Officer
|
Select the reporting officer
|
|
Related Plan
|
Select the related plan
|
|
KPI Performance
|
Select the KPI performance status
|
You can tick the 'Hide Inactive' and 'Hide Archived' check boxes to exclude the inactive and archived KPIs. If you wish to save the filter options you selected to be used next time, you can tick the 'Save as default' check box. You can use the 'Clear Filters' button to clear filter selections.
You can drag and drop a column header to the area shown below the period view selection in order to group the KPI by the column header


STEP 3: Click on the graph icon on a specific KPI record to view the graph.
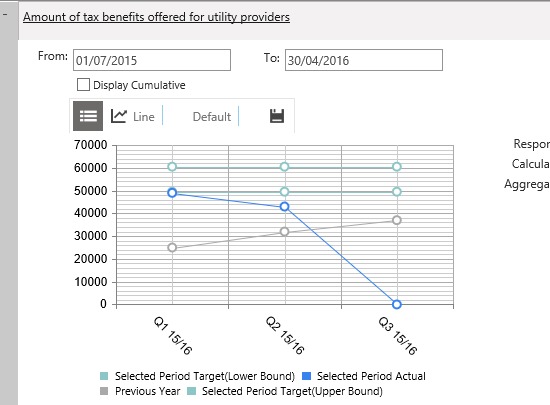
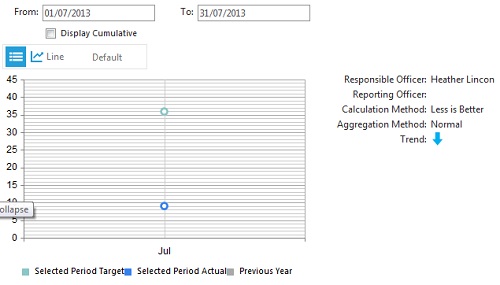
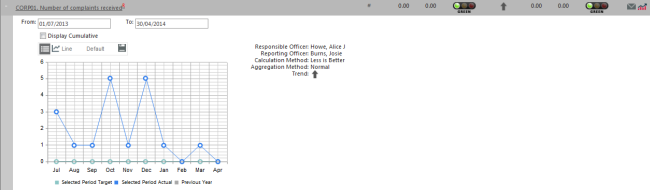
Please refer KPI Graph page for further explanation on the new functionality.
STEP 4: You can use the email icon to send email about the relevant KPI.
STEP 5: To find out more detailed information in relation to a KPI, click the KPI hyper-link. This will open in a new window so the EIS page remains open.
You have the option of exporting the data to an excel sheet by clicking on the 'Excel Export' icon.
|

|
Business Rules for Trend arrow display
Trends are calculated by comparing the targets and actuals from the current period to the targets and actuals to the previous period. The actual is compared as a percentage (performance) of the target. For example:
Month 1:
Target = 30
Actual = 15
Performance = 50%
Month 2:
Target = 20
Actual= 11
Performance = 55%
Depending on calculation methods and aggregation method the system will calculate KPI performance as a percentage of KPI target. Then current period YTD and previous period YTD are compared and a trend is shown.
Trend arrow display for Trend KPIs – the above is applicable for all KPIs with the exception of Trend KPIs. For Trend KPIs, there is no Performance to compare because there is no Target to calculate a Performance with. Thus, for Trend KPIs, the Trend arrow is determined by comparing the current period ACTUAL with previous period ACTUAL only.
|
Copyright © 2014-2015 CAMMS Online Help. All rights reserved.
Last revised: September 23, 2018