
The Year to Date period starts in the month of July and will be completed in the month of June in the immediate next calendar year.
EIS provides a set of controls on every page which gives you the ability to analyse information from different perspectives.
Period View Control
The Period View Control lets you view performance information for different time frames. The two options available are 'Year To Date' and 'Period'.
The period view can only be selected within the KPI and Scorecard areas. This means that you can view performance information for a specific time frame using the date controls.
|
|
The Year to Date period starts in the month of July and will be completed in the month of June in the immediate next calendar year. |
For example if you select ‘March’ in the month drop down and select the reporting period as 09/10 in the reporting period drop down then information from 01st of July 2009 to 31st March 2010 will be displayed.
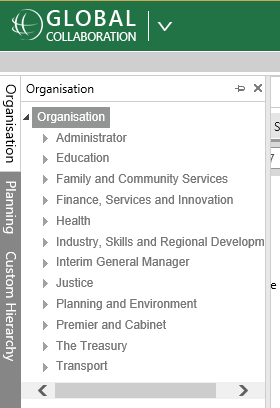
Hierarchy Tree Structure
The Hierarchy Tree Structure on the left allows you to filter information based on a selected level of either the planning or organisation or human resource trees.
Custom Hierarchies can also be selected to view information linked here if you have this functionality. See 'Custom Hierarchies' for more information.
|
|
EIS will always display Action, KPI and Budget performance at the level of logged in user and linked within the system by default. However, this can be changed by navigating through the hierarchy tree. |
STEP 1: Click on the relevant tab to dock a particular hierarchy structure.
STEP 2: Click on the plus sign to further expand a level.
STEP 3: Click on the level you want to view information for.
You can see what level of the tree you are currently viewing performance for at the top of the screen and also use this area to go back up the hierarchy.
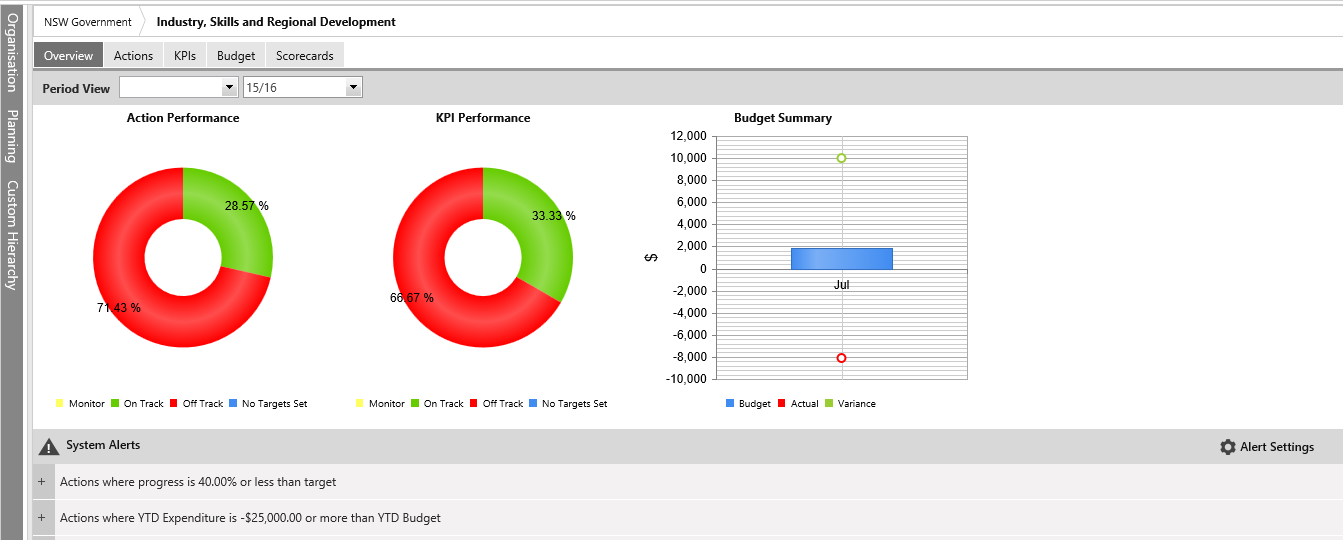
Chart Setting
By clicking on the chart setting, you will be able to configure properties listed below:
Action Performance Chart
The action filter drop-down will give you all the available action filters. When the action filter is used, actions would be filtered to show the actions that have the selected action filter ticked within action details page.
Budget Summary Chart
Through the budget filter, you will be able to filter the budget chart as
Income and Expenditure
Income Only
Expenditure Only
Filter
The filter icon enables you to conduct a search on the records available under the relevant tab, using a set of filters given.
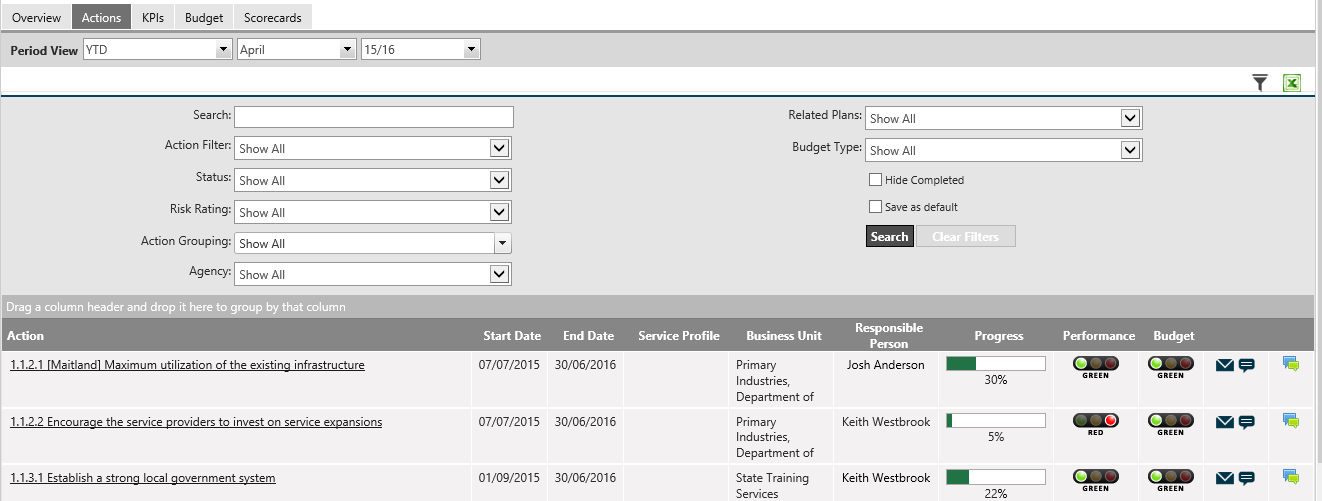
Grouping and Sorting
In many areas you can drag and drop columns to group information by a particular category. You can also click on a column to sort information alphabetically.
Exporting to Excel
Using ![]() icon, you can extract the information in an excel sheet. This function is available in all of the tabs to export the relevant data in excel format.
icon, you can extract the information in an excel sheet. This function is available in all of the tabs to export the relevant data in excel format.
Copyright © 2014-2015 CAMMS Online Help. All rights reserved.
Last revised: September 23, 2018