
The Budget graph only displays expenditure budgets. This is because expenditure is a controllable amount whereas income is not.
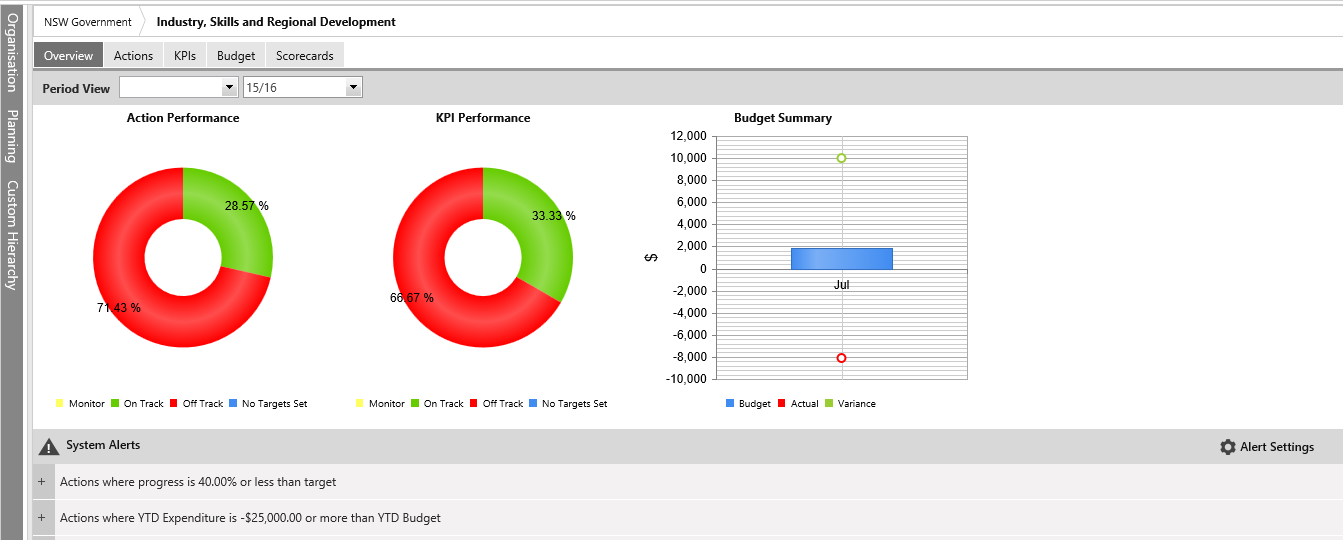
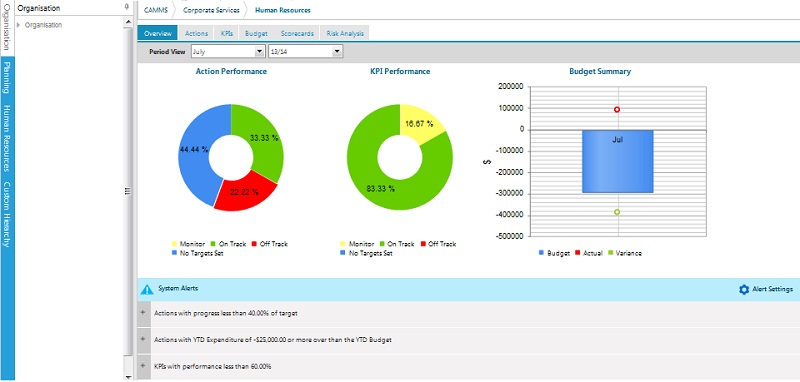
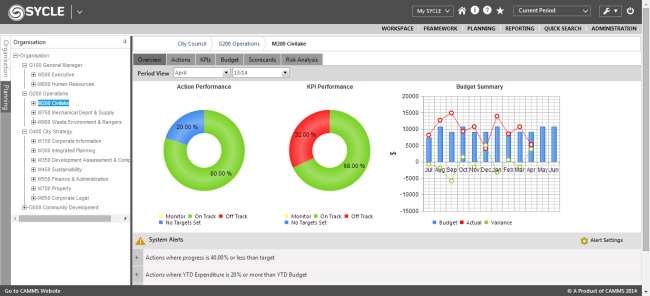
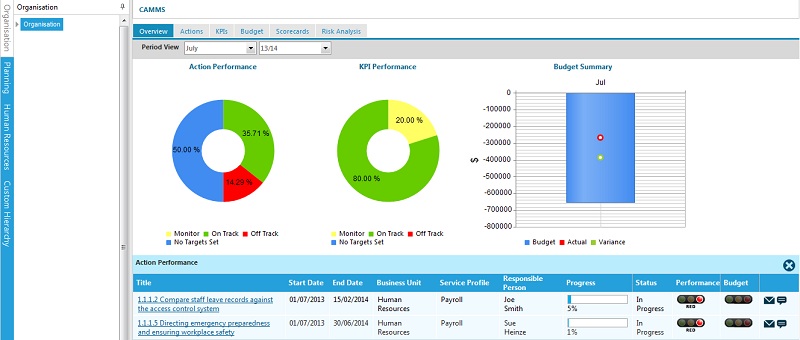
The EIS Overview tab summarises performance information across actions, performance indicators and budgets for a particular period and hierarchy level.
According to default settings, it shows data for the current year and last closed period* (this is shown within the period view) and the organisation level you are linked. However, you can make a selection by using the reporting year drop-down lists at the top of the page and the hierarchy tree control available on the left side of the panel.
* Actions will only show if they fall within the reporting year selected (have start and/or end dates within this financial year/period)
It also shows you alerts for items that are off track based on your personalised thresholds.
Two performance pie charts and a line chart are shown at the top for a ‘bird’s eye’ view of your Action, KPI and Budget performance respectively.
Action Performance: This pie graph will give you the performance of all actions within the particular hierarchy and reporting year that is showing (within period View). The performance is based on the period target (Period View Month and year) Vs YTD actual. If you have quarterly targets set, you will need to view for the month at the end of the period.
KPI Performance: This pie graph will give you all KPIs linked to the particular hierarchy level showing. The KPIs must be linked via the KPI linking area.
Currently, KPIs with no target set (nothing saved at all against targets/actuals tab) will not be displayed in EIS.
Performance will be based on the period view target and actual. Note: KPIs are all setup differently and calculation methods, periods and aggregation will impact KPI results.
For example (few different types of KPIs):
Annual KPIs will only show at the end of the reporting year (June view).
KPIs which have an aggregation of Cumulative will show a cumulative result (cumulative target and actual).
See KPIs section for more information on how different KPIs are calculated on the way that they are setup.
Budget Summary: This graph will show the Budget Vs Actual of all the Actions linked at the particular Hierarchy selected, for the period view.
|
|
The Budget graph only displays expenditure budgets. This is because expenditure is a controllable amount whereas income is not. |
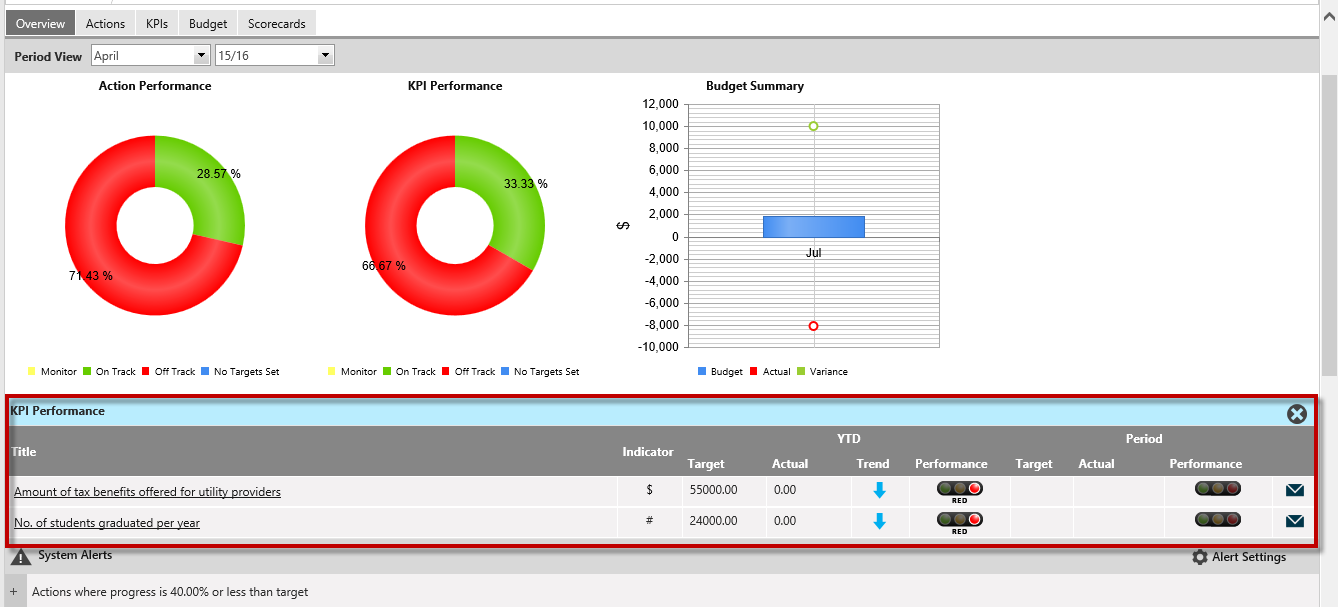
When you click on a coloured section of the pie chart, you would be able to see a detailed grid with the list of Actions/KPIs/budget contributed to the performance indicated by that colour.
Action Thresholds
Traffic light indicators will display the following based on the configurations within Planning and meticsinterplan settings> Progress Calculation area.
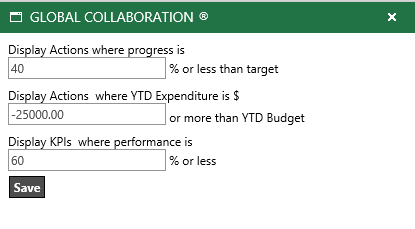
Traffic light indicators will display the following based on configurations within global collaboration.
On Track - 
Monitor - 
Off Track - 
Action Progress Traffic Light Indicator will display a blank (unlit)in following instances
For Ongoing Actions where the action progress values are not specified in the system by default.
Actions for which Target values have not been set within Action> Progress tab.
Traffic lights will be based on the periods performance - action YTD actuals against the period target.
Thresholds are set within the Admin area and can be changed to suit organisational requirements by the Administrator. See Action Progress Threshold area.
The default Threshold is: <<to be verified>>
On Track (>=) 90
Off track (<) 70
Monitor (<90 and >= 70) (based on the on track and off track numbers). Less than 90 and greater than or equal to 70.
System Alerts
Below panel that shows the performance graphs, you can see the customisable system alerts for Actions, KPIs and Budgets that require your attention in collapsible grids. You can customise your thresholds for when you want to be alerted for Actions, Budgets and KPIs from My Settings "Wrench" Icon > Administrative options > EIS Settings page.
Performance graphs, customized system alerts for Actions, KPIs and Budgets are displayed in collapsible grids. You can customise your thresholds in order to modify when to be alerted. Go to My Settings 'Wrench' icon and under Settings section, Action, Budget and KPI values can be edited for EIS system alerts. See below:
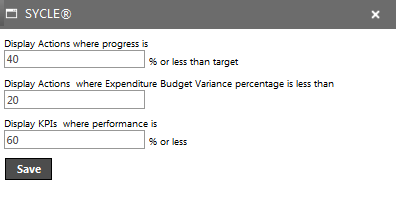
System Alerts can be configured for the following via the My SettingsEIS Settings page:
Action Exception - can define the exception value for action, in order to trigger the alert when the action progress is less than the given value
Budget Exception - can define the exception value for expenditure/budget of the action, in order to trigger the alert when the YTD expenditure is equal to the given value or more over than the YTD budget. You may enter the threshold value as a $ value or a %. This would depend on the configurations done by your Administrator. Please contact your Administrator for more information.
KPI Exception - can define the exception value for KPI, to trigger the alert when the performance is less than the given value,
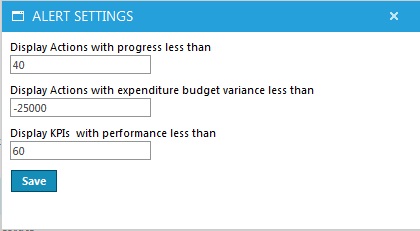
The same alerts can be configured through the pop up window that appears when you click on the Alert Settings. You can save the changes made in the values by clicking on the save option given in the pop up window.
Copyright © 2014-2015 CAMMS Online Help. All rights reserved.
Last revised: September 23, 2018