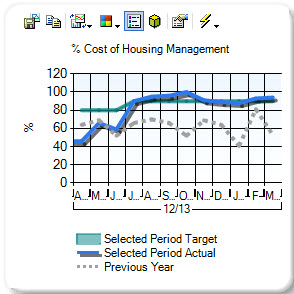
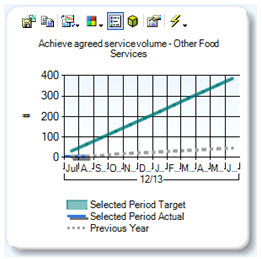
The Graph tab takes you to a screen where the Targets and Actuals for the KPI over a selected period will be displayed graphically. The same graph can be accessed by selecting a KPI and clicking the "View" Button on the homepage.
Copyright © 2014-2015 CAMMS Online Help. All rights reserved.
Last revised: September 23, 2018