These include:
These reports are designed to be filtered by any of the planning or organisational structures, showing quick summary information for KPIs linked at that level of that hierarchy, followed by more detailed KPI information and graphs.
Benefits:
At a glance snapshot of KPI performance
Can be run for planning or organisational structure
Ability to compare KPI performance over time
Trend analysis
The performance management area houses two premium reports:
|
Filters |
Description |
Default Selection |
|
Date Select |
Select the date range in 'From' and 'To' field. Will show KPIs which have targets and/or actuals within the period. |
Current financial year |
|
Hierarchy |
Select the name of the hierarchy from the drop-down menu. Premium Planning: This can be your strategic hierarchy (Goals, Outcomes, Strategies, Actions) or Premium Organisation: Organisational hierarchy (Directorate, Business Unit, Service). Note: Using this filter - KPIs being filtered into this report must be linked to the selected Hierarchy. |
Show All |
| Display Off Track items only | Tick this box only to display those KPIs which have a red traffic light (Off track). | Ticked OFF |
| Hide Target / Actual | Tick this box to hide the Target / Actuals columns | Ticked OFF |
| Display Confidential Actions and KPIs | Tick this box to display the confidential KPIs. Note: if you do not have access to view confidential then you will not see this filter. | Ticked OFF |
| Include Linked Risks | If you have IRM (CAMMS Integrated Risk Manager), then you can include references to the linked KPI. | Ticked OFF |
| Show Inactive Risks | If you have selected to include linked risks, you can choose to view the inactive risks or not. Tick this to show in active risks. | Ticked OFF |
The PREMIUM Organisational KPI report filters KPIs linked to the Directorates, Business Unit, Service Profile and Action level, and between any reporting periods.

The PREMIUM Planning KPI report filters KPIs linked to the Goals, Outcomes, Strategies and the Action level, and between any reporting periods.

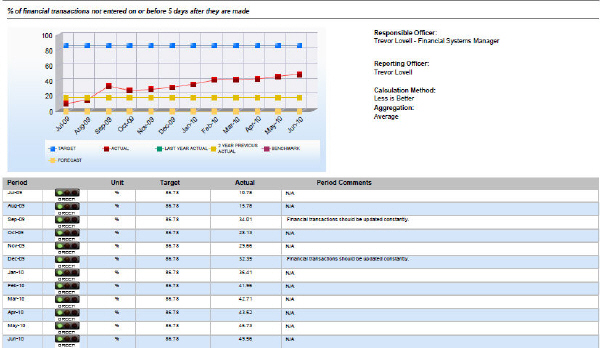
In both reports, the KPIs will appear in graph form with targets and actuals, as well as the Name and Position of the Staff member responsible for the KPI, and any Comments entered in the Notes field for the KPI.
Depending on the period you have selected to run the report by, it will show all periods with the data in the system.

Copyright © 2014-2015 CAMMS Online Help. All rights reserved.
Last revised: September 23, 2018