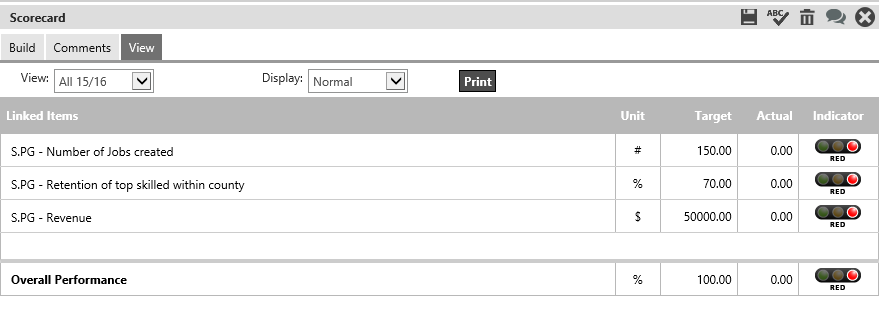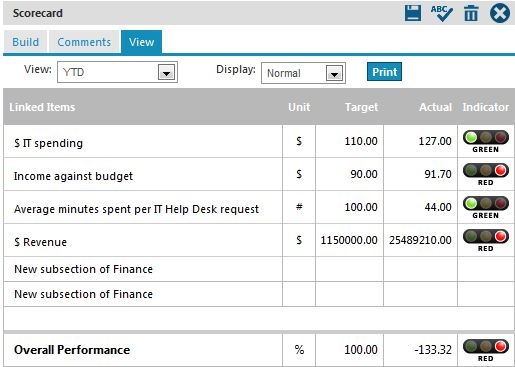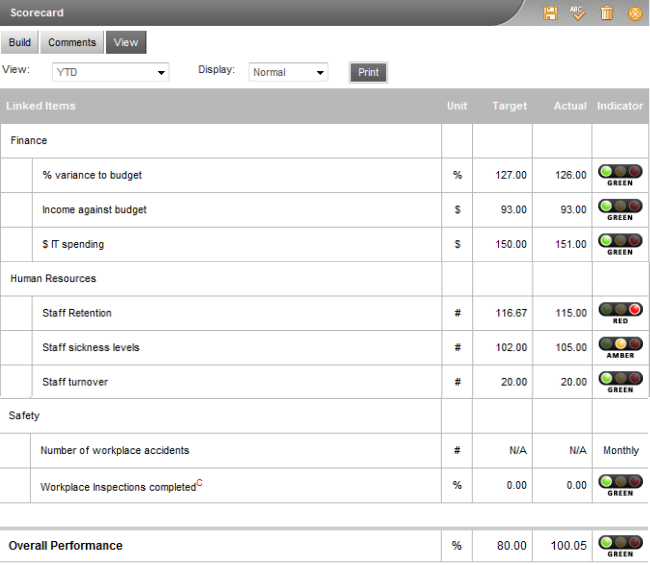
You can now view the scorecard by moving to the ‘VIEW’ tab.


STEP 1: Select the View period from the drop-down list.
Selecting YTD will show performance from beginning of financial year to the date you view scorecards.
Date range option will allow you to view performance information for a specific time-frame using the date controls.
Other time frame options are available in the drop-down menu
STEP 2: Select the Display format - the drop-down lists the variety of display formats available.
Normal view will display Unit, Target, Actual and indicator. Selecting complete view will include comments as well. Symbolic view only display the indicator and Text view will only show unit, target and actual.
STEP 3: Click on the ‘PRINT’ button to view a PDF version of the report.
|
|
Linked items are displayed on the Scorecard in bold text. Any items linked to these items are displayed in plain text underneath these linked items. For each of these lower level items, their unit, Target, Actual and Traffic Light can be displayed, depending on the ‘DISPLAY AS’ option selected.
The Overall Performance Traffic Light indicator is generated by comparing the Overall Performance Target against the Overall Performance Actual. See Example Scorecard Calculation. |
|
|
Including an inactive KPI in a Scorecard may cause incorrect values to be displayed. |
Copyright © 2014-2015 CAMMS Online Help. All rights reserved.
Last revised: September 23, 2018